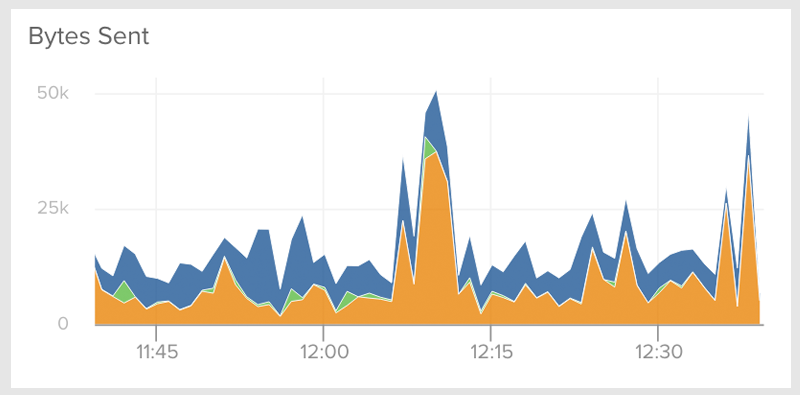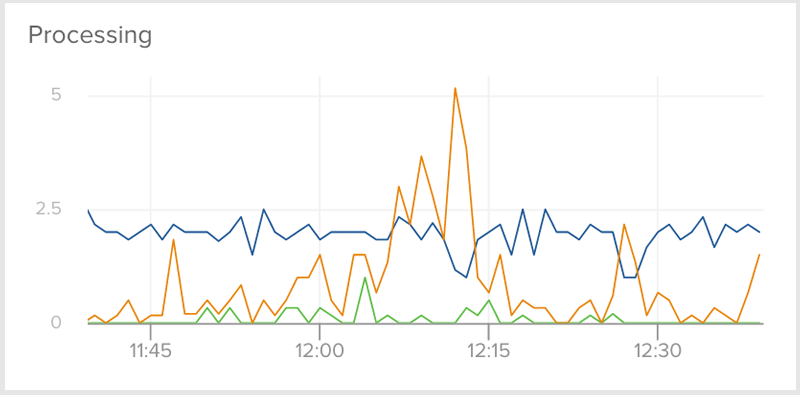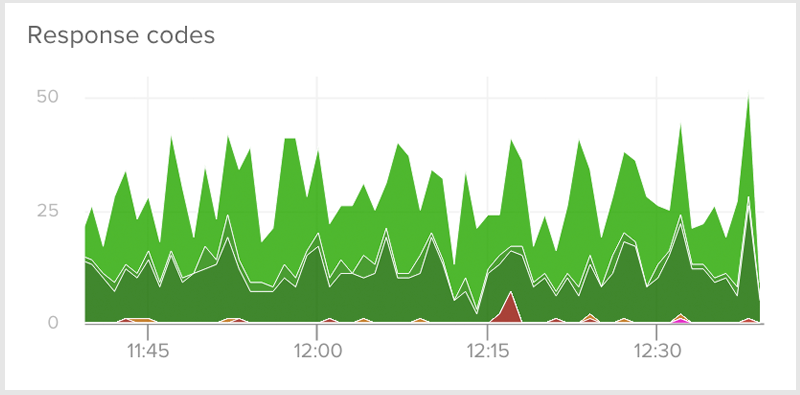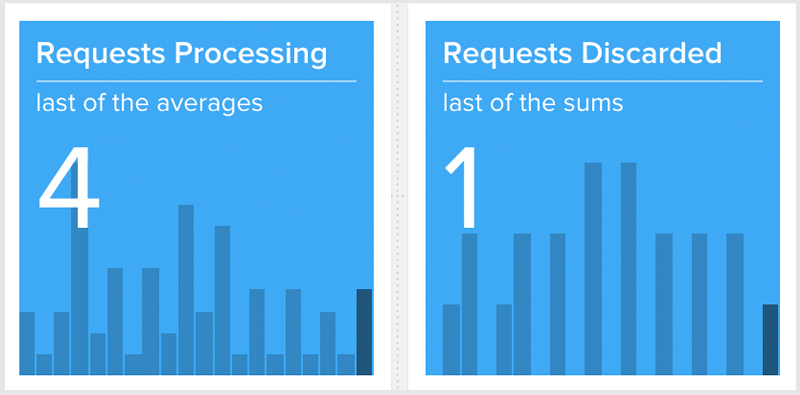
Optimized for seamless integration and high performance, making it drop-dead simple to monitor your NGINX performance metrics.
Simple setup
Measure the rate of client requests and connection latency
Count connections broken out by state
Quantify response codes
Preconfigured and customizable dashboards for an elegant display of your NGINX performance (alerting and notifications too).


It doesn’t matter how many NGINX servers you have, or how widely they are dispersed. Your preconfigured dashboard will always accurately and effortlessly depict your production traffic workload in real time.
Have you ever wished you had a single line graph that could show you the current magnitude of rate of request traffic across all of your NGINX instances? In a matter of minutes, our NGINX integration will arm you with elegant visualizations that break down the number of currently active, reading and writing client connections, as well as rate of requests per second.
The Librato Agent gathers your server metrics straight from the NGINX stub_status module. Your NGINX configuration needs only a few additional lines to begin shipping critically important performance metrics to your preconfigured Librato dashboard.
It only takes a few minutes to get started. Just use the integrations tab to add an integration, and then tack on an NGINX integration. Our UI will guide you through the steps you need to get up and running in no time.
In a matter of minutes, track these and other metrics that are vital to the well-being of your application.
| Category | Metric Name | Description |
|---|---|---|
| Connection Counting | Connections accepted, connections completed | The total number of client connections that have been accepted and successfully processed |
| Request Tracking | Total requests | Rate and number of client requests |
| Connection errors | Connections dropped | The percentage of prematurely terminated client connections |
| Connection Breakdown | Connections [reading,writing,active,waiting] | The current number of connections broken down by state. |
Content crafted by our engineers with only one goal: to help you monitor with ease.

“Librato is the fastest way to derive something enlightening from your data.”
RICHARD CROWLEY, DIRECTOR OF OPERATIONS, SLACK

Librato unifies your monitoring experience by integrating with every layer of the stack.