Optimized for seamless integration and high performance, it’s drop-dead simple to monitor your JVM metrics.
Simple setup
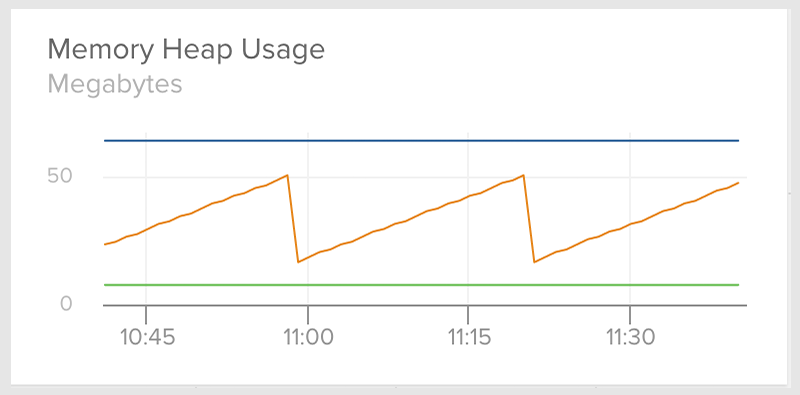
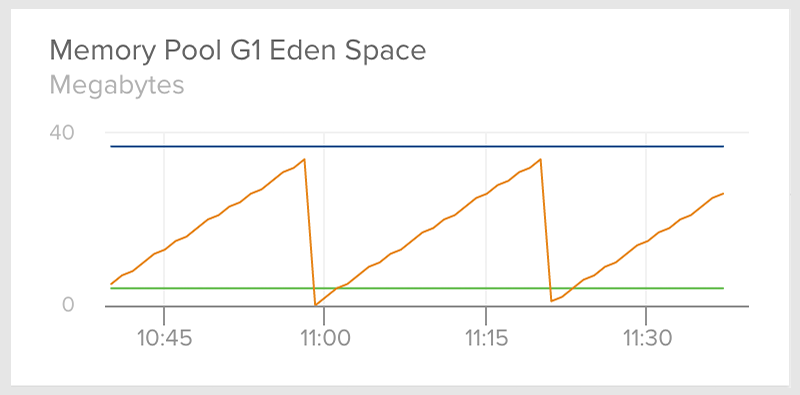
Heap & nonheap memory usage
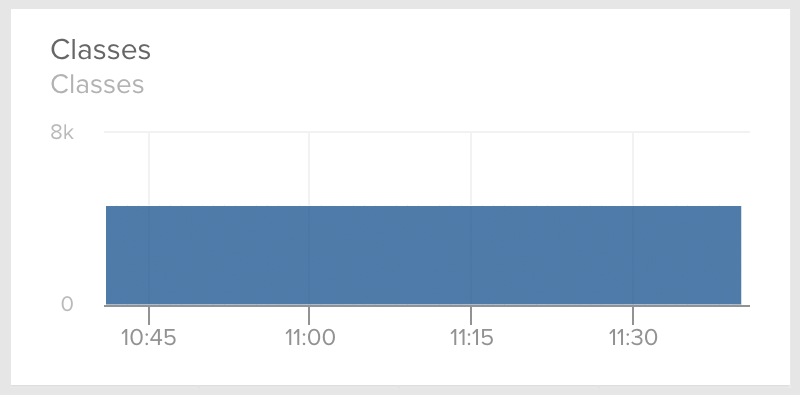
Loaded & unloaded classes
Preconfigured JVM dashboard
Elegant, flexible, and responsive, our Spaces UI will depict JVM metrics in real-time.


See your JVM metrics in real-time with Librato.
At the core of many well-known, high-traffic webapps, Java is one of the most popular languages these days. By leveraging Java’s JMX (Java Management Extensions) technology, which provides a standard interface for easily monitoring and managing your Java applications, Librato makes it simple and easy to monitor your app.
With Librato, you can easily keep an eye on JVM memory usage, thread utilization, and more.
When you’re ready to get started monitoring your Java app, simply enable our JVM integration and follow the short configuration instructions. You’ll be happily watching metrics in no time at all.
In a matter of minutes, track these and other metrics that are vital to the well-being of your application.
| Category | Metric Name | Description |
|---|---|---|
| Memory | Heap used | Amount of heap memory used |
| Memory | Nonheap committed | Amount of committed nonheap memory |
| Threads | Thread count | Number of running threads in the JVM |
| JVM | Loaded classes | Number of loaded classes in the JVM |
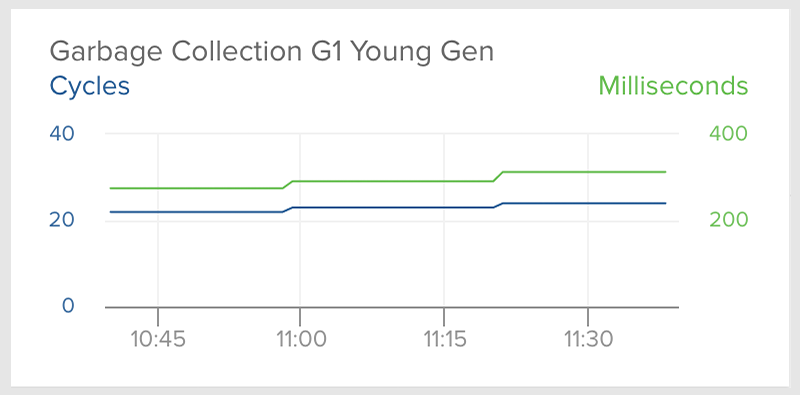
| JVM | Garbage collection count | Number of garbage collection invocations |
Content crafted by our engineers with only one goal: to help you monitor with ease.

“Librato is the fastest way to derive something enlightening from your data.”
RICHARD CROWLEY, DIRECTOR OF OPERATIONS, SLACK

Librato unifies your monitoring experience by integrating with every layer of the stack.