

Optimized for seamless integration and high-performance, making it drop-dead simple to monitor your containerized applications.
Simple setup
Preconfigured Docker dashboard
Per-container CPU, Network, and Memory metrics
No need to modify your images
Preconfigured and customizable dashboards for an elegant display of your Dockerized application performance (alerting and notifications too).


Effortless transparency for your containerized applications.
It’s difficult to measure the CPU utilization of processes isolated inside Docker Containers. The Librato Agent, however, makes it easy to collect and visualize system-level metrics from your dockerized application. Our in-house developed Docker plugin reads container metrics straight from the Docker Daemon, so you don’t need to modify your preexisting images in any way.
With Librato, Docker monitoring couldn’t be easier. Just use the integrations tab to set up the Librato Agent integration and then add a docker integration to it. You’ll then be guided through the steps you need to get up and running on your Docker hosts.
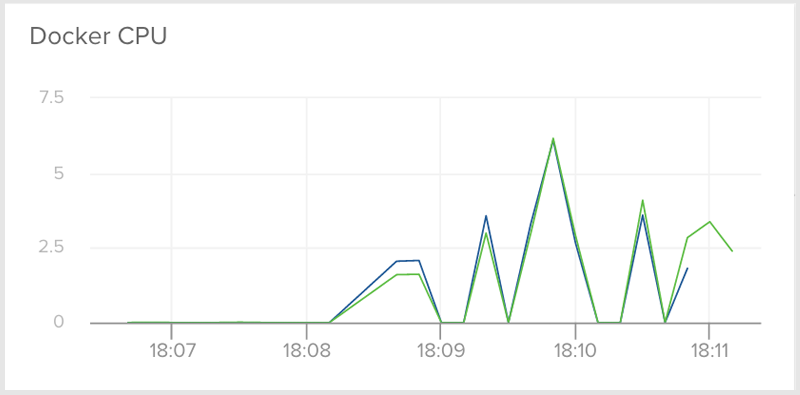
Once you have the agent installed and running, you’ll see data automatically begin to appear in your preconfigured Docker monitoring dashboard. A series of metrics specific to each of your containerized apps will help you spot performance problems and debug any inexplicable behavior occurring inside your process-isolated application.
The metrics exposed by the Docker daemon include per-container CPU utilization and throttling stats, Memory limits and utilization data, and Network utilization and error metrics. A detailed description of these metrics is available at the Docker runtime metrics page.
In a matter of minutes, track these and other metrics that are vital to the well-being of your application.
| Category | Metric Name | Description |
|---|---|---|
| CPU | Percent Utilization | The percent of time the CPU is in use |
| CPU | CPU Throttling | Number of times a CPU Quota was enforced |
| Memory | Memory Utilization | Breakdown of the amount of memory used by each containerized process |
| Network | Network Traffic | Number of bytes and packets sent over the container network interface |
| Network | Network Errors | Number of dropped packets and errors on the container interface |
Content crafted by our engineers with only one goal: to help you monitor with ease.

“Librato is the fastest way to derive something enlightening from your data.”
RICHARD CROWLEY, DIRECTOR OF OPERATIONS, SLACK
Librato unifies your monitoring experience by integrating with every layer of the stack.