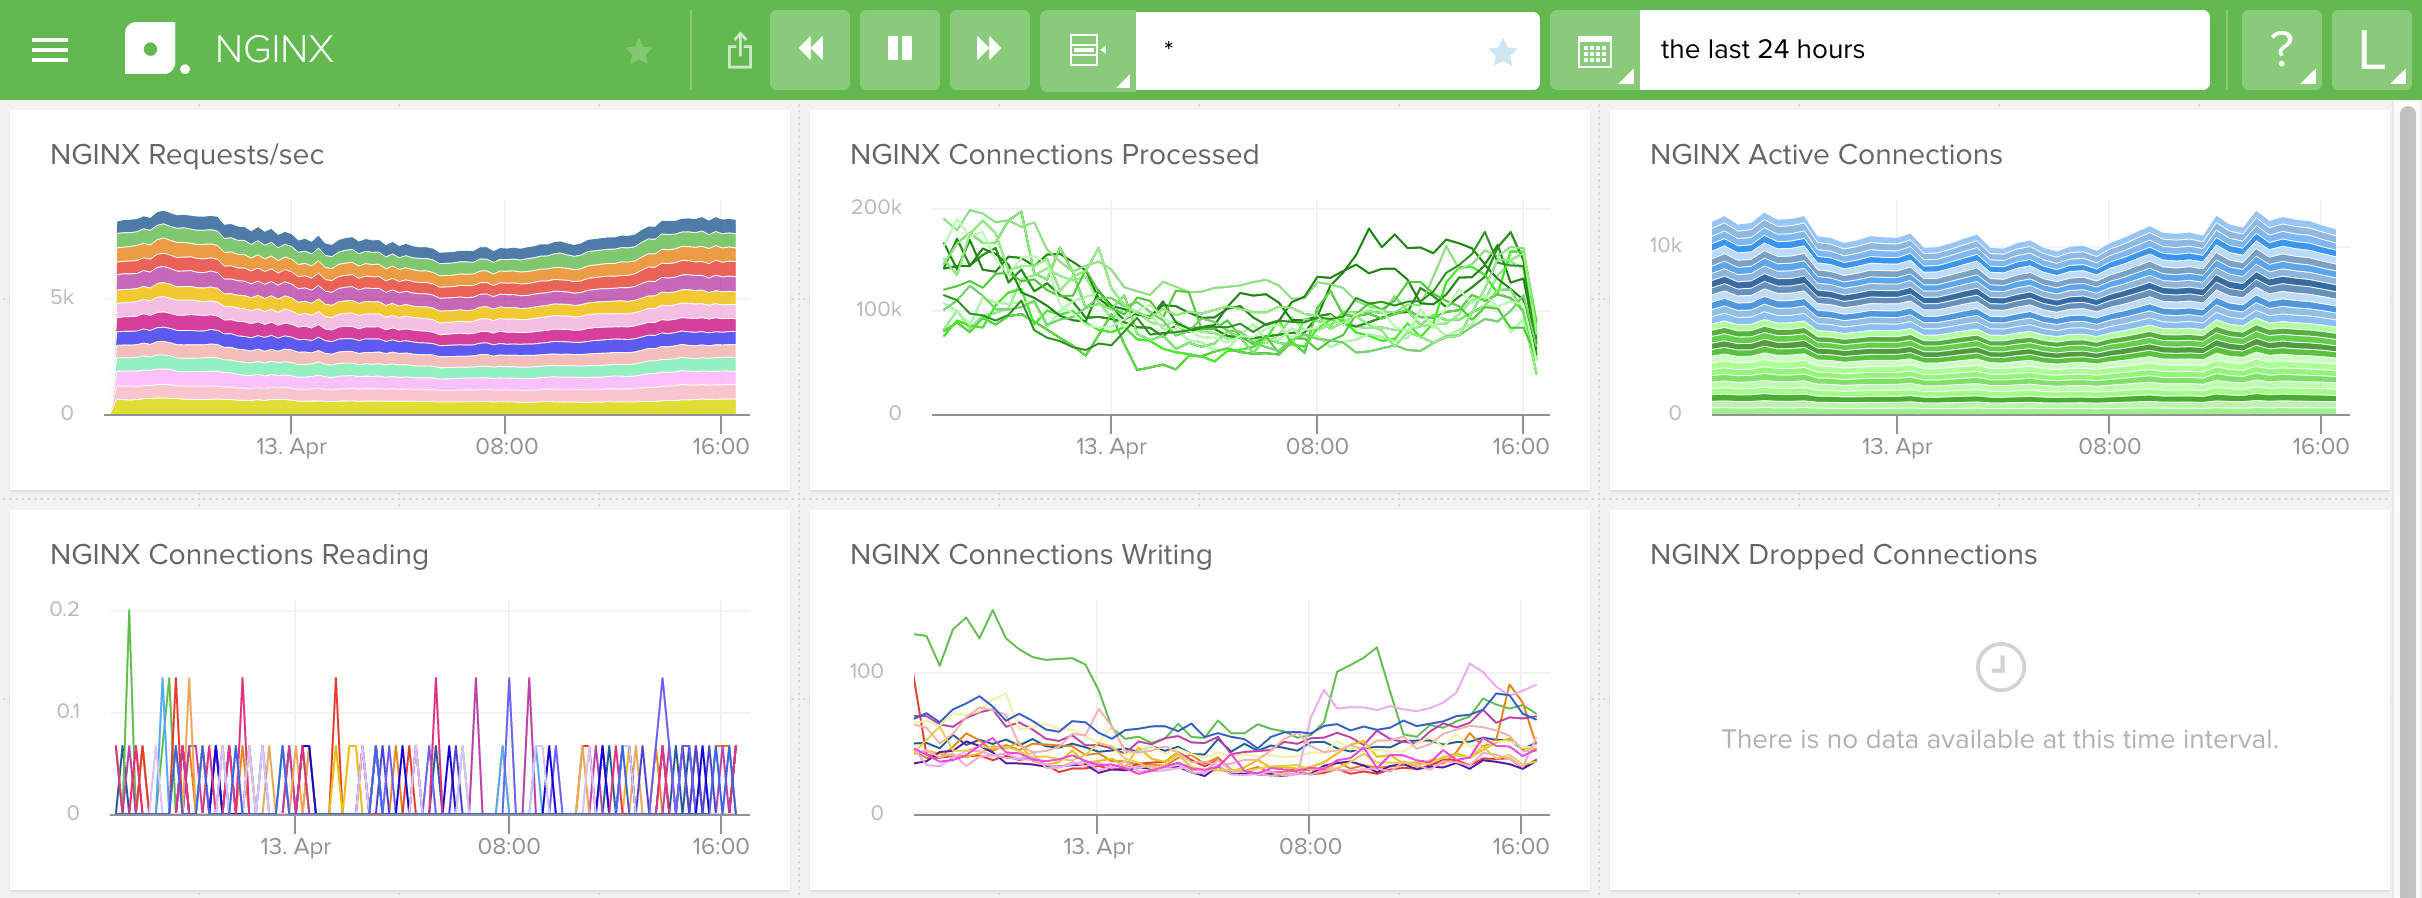
Optimized for seamless integration and high performance, making it drop-dead simple to monitor your web servers.
Simple setup
Enumerate connections
Quantify response codes
Annihilate latency
Preconfigured and customizable dashboards for an elegant display of your web server metrics (alerting and notifications too).

Granular, real-time performance data from all your web servers, together with your application and infrastructure metrics in one elegant, responsive, easy-to-use interface.
Modern web applications often span myriad web servers, application frameworks and databases. They are dynamic, widely distributed and ever changing, so why should your monitoring be a statically defined configuration burden? With Librato's turn-key web server integrations, it doesn't matter how many web servers you have in your tier or how often individual instances are recycled or scaled up.
Librato's agent installs with a single line of shell, and requires zero configuration. Real-time performance metrics are automatically shipped from your instances to our world-class metrics analysis UI, where you'll always see the current status of every instance across your entire environment.
New instances appear and retired instances disappear in your preconfigured dashboards without you ever having to touch a configuration button. Our UI makes it drop-dead simple to visualize your web server data alongside your system, database, and other custom metrics. You can make week-over-week comparisons, create new metrics from computations on existing ones, and stay up to date with alert notifications.
In a matter of minutes, track these and other metrics that are vital to the well-being of your application.
| Category | Metric Name | Description |
|---|---|---|
| Connection | Connection State | Current status of individual client connections (reading/writing/inactive/etc.) |
| Response | Response Code | Quantify HTTP response codes (200,302,404,500) |
| Traffic | Connection Rate | Rate of client connections |
| Errors | Errors | Rate and incidences of error responses |
| Proxy/LB | Upstream Connection | Availability of upstream proxy servers |
Content crafted by our engineers with only one goal: to help you monitor with ease.

“Librato is the fastest way to derive something enlightening from your data.”
RICHARD CROWLEY, DIRECTOR OF OPERATIONS, SLACK
